
Lightning network financial metrics
The channel annualized rate of return
In this series of articles, we will introduce metrics to evaluate the financial performance of Lightning Network channels and nodes. Managing an LN node often requires sophisticated architectures and ongoing management to ensure high liquidity and reliability. One of the most critical points for a node operator is to secure the node against loss of funds, breaches, or possible attacks. However, one point that remains less frequently discussed is the opportunity cost of locking capital into a channel and ways to measure this cost.
LN unit economics
To illustrate our approach, we took an example of a semi-fictitious channel with the following characteristics:
Channel size: 1M sats
Channel opening
The on-chain fee for the funding transaction was calculated based on a size of 1500vB and a fee of 5sat/vB.
Channel open and live
In our example, we estimate a net total of 80000 sats earned over the channel´s lifetime and include possible rebalancing fees.
Channel Closing
We make the assumption that the channel balance is the same at the opening and the closing.
The HTLCs will release the local and remote reserves to their owners for a cooperative close. Therefore, reserves shouldn’t be accounted for in the PNL statement or cash flow. Similarly, commit fees are kept as a buffer to close the channel and permit the final closing transaction.
We assume that on-chain fees have decreased to 2sat/vB at the moment of closing, and the channel doesn’t have pending htlcs. Details are shown in Figure 1.
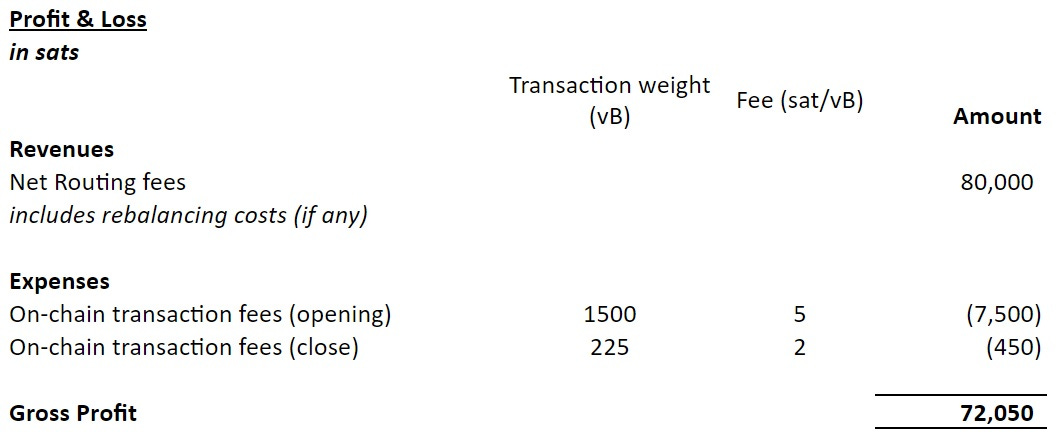
In this example, the channel has routed enough payments during its lifetime to generate profits. As shown in Figure 2, the amount available at closing is higher than the capital initially locked in the channel.

Return on Investment
The return of investment, or ROI, can perfectly help a node operator to evaluate the profitability of a channel by dividing the gross profit by the initial investment, i.e. capital locked, but it doesn't take into account the time value of money. In our example, the ROI would yield a generous return of 7.2% (72050 / 1000000). Even if this rate gives a first level of information, a more sensible approach would be to take into account the channel lifetime and the time when transactions were actually routed.
Discounted Cash Flow method: the CARR
For decades, investors have been using well-known indicators such as the "Net Present Value" or the "Internal Rate of Return" to measure and compare the effective return of investments. These indicators are particularly well suited for projects when initial investments or project duration are different.
We adapted these indicators to a channel's unit economics to offer node operators the tools to identify the best-performing channels and allocate their capital efficiently.
We introduce the Channel Annualized Rate of Return, or CARR, to estimate the performance of an investment in a channel as per the following formula:
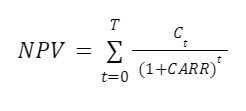
Where:
NPV: Net Present Value (sats)
Ct = Net cash flow during the channel´s lifetime (sats)
t = time of the transaction (seconds)
T= total lifetime of a channel (seconds)
CARR (%) = Channel Annualized Rate of Return
By definition, the CARR, or IRR in traditional finance, represents the rate that makes the net present value (NPV) of all cash flows equal to zero in a discounted cash flow analysis, expressed as an annualized rate. The higher the CARR, the more profitable the channel. This formula applies to closed channels to evaluate their actual return or to open channels to estimate the “committed” return.
A LN channel presents key differences from traditional finance such as a shorter lifetime, a higher speed of transactions, and also more unpredictable flows. For example, while investment analysis usually projects cash flows over months or years, LN theoretically allows a channel to be open for an hour, and payments flow every second. Therefore, as shown in figure 3, our model calculates all cash flow with a unit of time of a second. Also, while a discounted cash flow analysis is usually built on top of semi-realistic models, it is very difficult to predict future cash flows on an LN channel.
To gain a more accurate estimate of the return, we constructed a discounted cash flow whose time unit, in seconds, is shown in UNIX Time and a human-readable format. We considered a channel with a lifetime of 14 months that has seen irregular cash flows as shown in Figure 3. Transactions start flowing a few days after the channel opening and the volume keeps on growing until the closing. Data shared in this model don´t reflect the reality of a channel because no single transaction would be large enough to generate 45000 sats of routing fees at once but we had to simplify the model.

In our example, the discounted cash flow exhibited a CARR of 6.302%, while the ROI was 7.2%. The differences we observe in these returns can be explained by the fact that CARR method captures the time value of money. Also, we observed that ROI was higher than CARR, but this is not always the case; if a channel's total lifetime is lower than a year, which is frequent in LN, the absolute value of the CARR will be higher than the ROI. Last, if a channel doesn’t route sufficient payments and on-chain fees still need to be paid at opening and closing, then the CARR will go into negative territory.
Conclusion
The purpose of this article was to introduce better financial metrics to evaluate the profitability of the smallest element on the lightning network; the channel. First, we introduced the unit economics of an LN channel, and we provided an estimation of the return on investment of this channel. Then we proposed the Channel Annualized Rate of Return formula to consider cash flows and the time value of money. Finally, the differences between a discounted cash flow calculation such as CARR and the return on investment have been discussed. Specifically, we demonstrated that returns calculated with a discounted cash flow such as the CARR will be more accurate than ROI because the time value of money is accounted for.
Our intention was to offer node operators better tools to determine whether their nodes are operated efficiently and whether investments in channels are worthwhile. While we focused our efforts on analyzing the unit economics of a channel in this first article, our broader goal is to foster discussions in the LN community to come up with open metrics.